


Cancer-Associated Protein Kinase C Mutations Reveal Kinase’s Role as Tumor Suppressor

 Article Info
To view the full text, please login as a subscribed user or purchase a subscription. Click here to view the full text on ScienceDirect.
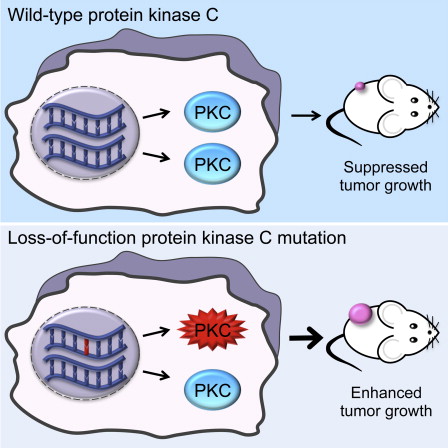
Figure 1
A Multitude of Cancer-Associated Mutations Have Been Identified within the Nine PKC Genes
(Left) Domain structure of conventional (α, β, γ), novel (δ, ε, η, θ), and atypical (ζ, ι) PKC members showing priming phosphorylation sites: activation loop (pink), turn motif (orange), and hydrophobic motif (green). (Right) Number of TCGA cases with cancer-associated mutations (missense, nonsense, insertions, deletions, splice site, or translation start site) identified within each of the PKC genes.
Figure 2
PKC Mutations in the Regulatory C1 and C2 Domains Are LOF
(A) Solution structure of the C1A domain of PKCγ (PDB 2E73) showing the corresponding PKCα His75 residue that coordinates Zn2+ and PKCα Trp58.
(B) Normalized FRET ratio changes (mean ±SEM) representing DiC8- (10 μM) followed by PDBu- (200 nM) induced PKC activity as read out by CKAR in COS7 cells co-expressing CKAR and either mCherry-tagged WT, mutant PKCα, or no exogenous PKC (endogenous).
(C) (Left) Representative YFP images of the indicated PKC isozymes under basal and PDBu-treated conditions (200 nM; 15 min) showing relocalization of WT, but not mutant PKCα, to membranes. (Right) Normalized FRET ratio changes (mean ±SEM) quantifying translocation of YFP-tagged PKCα proteins toward a membrane-targeted CFP upon stimulation with 10 μM DiC8, followed by 200 nM PDBu.
(D) Normalized FRET ratio changes (mean ±SEM) showing PKC translocation following UTP (100 μM) stimulation.
(E) Immunoblot showing the phosphorylation state of the indicated YFP-tagged PKCα proteins.
(F) Crystal structure of the C2 domain of PKCγ (PDB 2UZP) highlighting Asp193 and Asp254 residues involved in Ca2+ binding.
(G) Normalized FRET ratio changes (mean ±SEM) showing PKC activity as read out by CKAR upon elevation of intracellular Ca2+ stimulated by thapsigargin (5 μM), followed by PDBu (200 nM).
(H) Normalized FRET ratio changes (mean ±SEM) showing translocation of YFP-tagged PKCγ constructs toward membrane-localized CFP upon stimulation of COS7 cells with thapsigargin (5 μM) followed by PDBu (200 nM). Data were normalized to the maximal amplitude of translocation for each cell and then scaled from 0 to 1 using the equation: X = (Y − Ymin)/(Ymax − Ymin), where Y = normalized FRET ratio, Ymin = minimum value of Y, and Ymax is maximum value of Y.
(I) Normalized FRET ratio changes displaying oscillatory translocation of YFP-tagged WT PKCγ, but not PKCγ mutants D193N and D254N, in HeLa cells co-expressing membrane-targeted CFP and stimulated with 10 μM histamine. Data are representative traces from individual cells of three independent experiments.
See also Figure S1 .
Figure 3
PKC Mutations in the Kinase Domain Are LOF
(A) Crystal structure of the kinase domain of PKCβII (PDB 2I0E) highlighting cancer-associated residues and the regulatory spine (yellow space filling).
(B) Normalized FRET ratio changes (mean ±SEM) showing PKC activity of PKCδ constructs in COS7 cells co-expressing the plasma membrane-targeted, PKCδ-specific reporter PM-δCKAR. Cells were stimulated with UTP (100 μM) followed by PDBu (200 nM).
(C) Immunoblot analysis of the phosphorylation state of PKCδ WT and mutants.
(D) Representative mCherry images of mCherry-tagged PKCη WT or mutants showing localization under basal conditions and 15 min post 200 nM PDBu addition to COS7 cells.
(E) (Left) Immunoblot showing PKC substrate phosphorylation. COS7 cells overexpressing the indicated constructs were pre-treated with 4 μM Gö6976 for 10 min to inhibit cPKC isozymes and were then stimulated or not with 200 nM PDBu to activate nPKC isozymes. (Right) Immunoblots were quantified and normalized to total PKCη levels and tubulin. Data represent averages of three independent experiments ±SEM. Comparisons for basal and stimulated activity were made using a repeated-measures one-way ANOVA followed by post hoc Dunnett’s multiple comparison test. ∗p < 0.05 as compared with the WT group.
(F) Immunoblot analysis of the phosphorylation state of mCherry-tagged PKCη WT and mutants.
(G) Normalized FRET ratio changes (mean ± SEM) showing PKC activity from COS7 cells co-expressing CKAR and RFP-tagged PKCγ mutants stimulated with 200 nM PDBu.
(H) Immunoblot depicting PKCγ WT and P524R phosphorylation. The asterisk denotes phosphorylated and the dash unphosphorylated PKCγ.
(I) Normalized FRET ratio changes (mean ±SEM) showing PKC activity of PKCβII constructs in COS7 cells co-expressing CKAR. Cells were stimulated with UTP (100 μM) followed by PDBu (200 nM).
(J) Immunoblot depicting mCherry-tagged PKCβII WT and mutant phosphorylation. The asterisk denotes phosphorylated and the dash unphosphorylated PKCβII.
See also Figure S1 .
Figure 4
The Majority of PKC Mutations Are LOF
(A) Pie chart of the functional impact of the investigated PKC mutations, with bright red representing mutations that lack any activity, medium red representing mutations that show no response to physiological stimuli (DAG or Ca2+ elevation) but some response to non-physiological phorbol esters, light red representing mutations that display reduced activity to physiological stimuli compared to the corresponding WT isozyme, and blue representing no difference from the corresponding WT PKC isozyme.
(B) Domain structure of cPKC, nPKC, and aPKC isozymes, overlaid with the LOF mutations color coded by isozyme.
(C) Crystal structure of the kinase domain of PKCβII (PDB 2I0E) highlighting “warmspot” residues mutated in at least four tumor samples within the various PKC isozymes.
(D) Bar graph depicting the percentage of mutations distributed in the indicated cancers for each PKC isozyme.
Figure 5
Correction of a Heterozygous LOF PKCβ Mutation Reduces Growth in Soft Agar, Suspension, and a Xenograft Model
(A) Immunoblot (left) and quantification (right; mean ±SEM) of PKCβII, PKCα, and GAPDH levels in the DLD1 cells.
(B) Immunoblot (left) and quantification (right; mean ±SEM) of phospho-(Ser) PKC substrates. Comparisons were made using a repeated-measures one-way ANOVA followed by post hoc Dunnett’s multiple comparison test. ∗p < 0.05 as compared with the DLD1 parental cells. Data represent the mean of three independent experiments ± SEM.
(C) Relative viable cell number (mean ±SEM) as assessed by a trypan blue exclusion assay after 72 hr in suspension from three independent experiments. Comparisons were made by using a one-way ANOVA followed by post hoc Dunnett’s Multiple Comparison test. ∗∗∗p < 0.001 as compared with the DLD1 parental cell group.
(D) Representative phase contrast images of DLD1 cells grown in suspension for 24 hr.
(E) (Left) Colony formation assay in soft agar. (Right) Quantification of colony area (mean ±SEM) for colonies with a diameter ≥50 μm from three to six independent experiments. Comparisons were made using a one-way ANOVA followed by post hoc Tukey’s multiple comparison test. ∗∗∗∗p < 0.0001 and ∗∗∗p < 0.001 as compared with the DLD1 parental cell group.
(F) Tumor growth is presented as the mean tumor volume (mm3) ±SEM, with the red representing data from mice injected with the DLD1 parental cells (A509T/WT; five mice) and purple representing data of the three corrected clones (17 mice total). Comparisons were made using a two-tailed, unpaired Student’s t test for each time point. ∗∗p < 0.005 and ∗∗∗p < 0.0005.
(G) (Top) Representative fields from TUNEL-stained slides of tumors derived from the DLD1 cells. (Bottom) Quantification of TUNEL-positive nuclei (mean ±SEM). Comparisons were made using a one-way ANOVA followed by post hoc Dunnett’s Multiple Comparison test. ∗∗∗∗p < 0.0001 as compared with the DLD1 parental cell group.
See also Figure S2 .
Figure S1
PKC Mutations that Reduce Its Activity, Related to Figures 2 and 3
(A) Normalized FRET ratio changes showing basal PKC activity of the indicated mCherry-tagged PKCα constructs in COS7 cells co-expressing CKAR that were treated with 1 μM of PKC inhibitor Gö6976. FRET ratios represent mean ± SEM from at least 3 independent experiments.
(B) Normalized FRET ratio changes showing PKC activity of the indicated mCherry-tagged PKCα constructs in COS7 cells co-expressing plasma membrane-targeted CKAR that were stimulated with 10 μM DiC8 followed by 200 nM PDBu. FRET ratios represent mean ± SEM from at least 3 independent experiments.
(C) Normalized FRET ratio changes showing PKC activity of the indicated mCherry-tagged PKCβII constructs in COS7 cells co-expressing CKAR that were stimulated with 100 μM UTP followed by 200 nM PDBu. FRET ratios represent mean ± SEM from at least 2 independent experiments.
(D) Normalized FRET ratio changes showing PKC activity of the indicated RFP-tagged PKCγ constructs in COS7 cells co-expressing CKAR that were stimulated with 100 μM UTP followed by 200 nM PDBu. FRET ratios represent mean ± SEM from at least 3 independent experiments.
(E) Normalized FRET ratio changes showing PKC activity of the indicated mCherry-tagged PKCα constructs in COS7 cells co-expressing CKAR that were stimulated with 100 μM UTP followed by 200 nM PDBu. FRET ratios represent mean ± SEM from at least 3 independent experiments.
(F) Immunoblot analysis of the phosphorylation state at the activation loop and total levels of indicated mCherry-tagged PKCα constructs overexpressed in COS7 cells.
(G) Immunoblot analysis of the phosphorylation state at the activation loop and total levels of HA-tagged PKCζ WT and E421K and empty vector (-) overexpressed in COS7 cells. Arrow shows exogenous phospho-PKCζ and asterisk shows endogenous PKC activation loop phosphorylation.
(H) Immunoblot showing activation loop phosphorylation and total levels of HA-tagged PKCβII WT and mutants overexpressed in COS7 cells. Blot at the same exposure was cropped to juxtapose WT and G585S.
(I) Immunoblot analysis of the phosphorylation state at the activation loop and total levels of mCherry-tagged PKCβII WT and Y417H overexpressed in COS7 cells.
(J) Immunoblot analysis of the phosphorylation state at the activation loop and total levels of indicated RFP-tagged PKCγ constructs overexpressed in COS7 cells.
(K) Normalized FRET ratio changes showing PKC activity of the indicated mCherry-tagged PKCε constructs in COS7 cells co-expressing CKAR that were stimulated with 100 μM UTP followed by 200 nM PDBu. FRET ratios represent mean ± SEM from at least 4 independent experiments.
(L) Normalized FRET ratio changes showing basal PKC activity of the indicated mCherry-tagged PKCε constructs in COS7 cells co-expressing CKAR that were treated with 6 μM of PKC inhibitor Gö6983. FRET ratios represent mean ± SEM from at least 2 independent experiments.
Figure S2
CRISPR-Mediated Genome Editing of PKCβ A509T Mutation, Related to Figure 5
(A) Immunoblot analysis of PKCβ in HCT116 cells expressing PKCβII under the control of a tetracycline (tet)-inducible promoter and control parental HCT116 cells lacking the PKCβII transgene, in the presence or absence of 1 μg/μl tetracycline (left panel). Colony formation assay in soft agar (middle panel). Transgenic HCT116 cells in the absence of tetracycline and control cells lacking the PKCβII transgene are permissive to colony growth in soft agar. Overexpression of PKCβII upon treatment with 1 μg μl-1 tetracycline diminished growth in soft agar. Quantification of number of colonies with a diameter greater than 100 μm (right panel). Graph represents averages ± SEM from 2 independent experiments performed in triplicate. ∗∗∗, p < 0.0005 according to a two-tailed, unpaired Student’s t test.
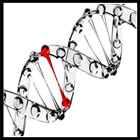
(B) Schematic representation of the PKCβ genomic locus targeted for CRISPR/Cas9-mediated genome editing with the A509T (G:C - > A:T) mutation highlighted in red. The mutant DNA sequence is shown above and the corresponding protein sequence below. Oligonucleotides used as templates for gRNAs, PKCβ-a and PKCβ-b, are underlined in black with the protospacer adjacent motif (PAM) sequence underlined in red. The sites of cleavage are marked by scissors. The sequence for the donor ssODN used is highlighted in green (except it contained the wild-type “G” allele instead of the mutant “A”). BtgZI shows cleavage site used for diagnostic restriction enzyme digest.
(C) DNA sequencing results of DLD1 parental cells and the 3 corrected clones with red box highlighting the corrected base pair.
(D) Graph showing similar growth rates of DLD1 parental and the 3 corrected clones from a crystal violet proliferation assay. Data represent mean ± SEM from 3 independent experiments performed in triplicate.
(E) Sequences of the PKCβ clone WT/- 23 alleles showing the intact WT allele and the mutant allele that was knocked out by a frameshift deletion spanning the exon (capital letters)/intron (lower-case letters) junction and chromatograms depicting deletion are shown.
(F) Immunoblot analysis of PKCβII, and ERK levels in the DLD1 cells.
(G) Graph showing volume of tumors (day 42; mean ± SEM) obtained from nude mice injected subcutaneously with 3 × 10⁶ DLD1 parental (A509T/WT) or DLD1 corrected (WT/WT 26, WT/WT 31, or WT/WT 53) cells. Comparisons were made using a one-way ANOVA followed by a post hoc Dunnett’s multiple comparison test: ∗p < 0.05.
Figure S3
DNA Copy Number Levels and mRNA Expression Correlations, Related to Figure 4
Graphs displaying correlations between log2 mRNA expression levels and the GISTIC copy number score for the conventional PKC genes: PRKCA (PKCα; r2 = 0.0017), PRKCB (PKCβ r2 = 0.016), and PRKCG (PKCγ r2 = 0.00012), and the atypical PRKCI (PKCι r2 = 0.23). 0 represents a diploid gene, 1 represents a single copy gain, and 2 shows high-level amplification or multiple-copy gains. Boxes indicate the median and the 25th and 75th percentiles; whiskers extend to highest (or lowest) value that falls within 1.5× the interquartile range.
Highlights
- •Cancer-associated PKC mutations are LOF and can act in a dominant-negative manner
- •Correcting a heterozygous PKCβ LOF mutation reduces tumor volume
- •Hemizygous deletion shows PKC is haploinsufficient for tumor suppression
- •Therapeutic strategies should aim to restore PKC activity instead of inhibiting it
Summary
Protein kinase C (PKC) isozymes have remained elusive cancer targets despite the unambiguous tumor promoting function of their potent ligands, phorbol esters, and the prevalence of their mutations. We analyzed 8% of PKC mutations identified in human cancers and found that, surprisingly, most were loss of function and none were activating. Loss-of-function mutations occurred in all PKC subgroups and impeded second-messenger binding, phosphorylation, or catalysis. Correction of a loss-of-function PKCβ mutation by CRISPR-mediated genome editing in a patient-derived colon cancer cell line suppressed anchorage-independent growth and reduced tumor growth in a xenograft model. Hemizygous deletion promoted anchorage-independent growth, revealing that PKCβ is haploinsufficient for tumor suppression. Several mutations were dominant negative, suppressing global PKC signaling output, and bioinformatic analysis suggested that PKC mutations cooperate with co-occurring mutations in cancer drivers. These data establish that PKC isozymes generally function as tumor suppressors, indicating that therapies should focus on restoring, not inhibiting, PKC activity.