

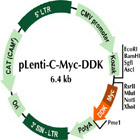

Mitochondrial Genome Acquisition Restores Respiratory Function and Tumorigenic Potential of Cancer Cells without Mitochondrial DNA

 Article Info
To view the full text, please login as a subscribed user or purchase a subscription. Click here to view the full text on ScienceDirect.
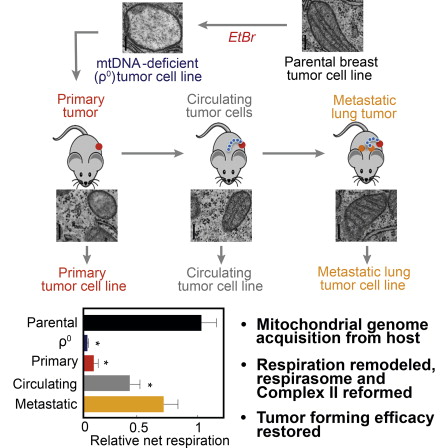
Figure 1
Tumor Cells without mtDNA Show Delayed Tumor Growth
(A) B16 and B16ρ0 cells (105) were injected s.c. into C57BL/6 or NOD/scid mice, and tumor growth was monitored. These cells and cell lines derived from s.c. tumors and lung metastases that grew from B16ρ0 cells were also injected i.v. into NOD/scid mice, and lung weight and tumor colonies were determined.
(B) 4T1 and 4T1ρ0 cells were injected s.c. or orthotopically into the mammary fat pad of Balb/c mice, and tumor growth was monitored. These cells and 6TG-resistant cell lines derived from s.c. tumors and lung metastases that grew from 4T1ρ0 cells were also injected i.v. into Balb/c mice, and lung weight and tumor colonies were determined. Images of lungs from these mice are also shown.
(C) 4T1, 4T1ρ0, 4T1ρ0SC, 4T1ρ0CTC, and 4T1ρ0SCL cells were injected into Balb/c mice, and tumor growth was monitored.
(D) Oxygen consumption by tissue of tumors derived from cells as stated above (C) was compared with respiration of liver tissue obtained from the same mice.
(E) Histological staining of tissue sections from (C) stained with H&E; scale bar, 20 μm. Data are from three independent experiments, and the results are expressed as mean ± SD. The symbol ∗ denotes significant differences with p < 0.05 and ∗∗ p < 0.001.
Figure 2
Tumors Derived from Cells without mtDNA Contain mtDNA of Host Origin
(A) Left panels: Cytb PCR analysis of B16, B16ρ0, and B16ρ0SC and B16ρ0SCL tumor sublines from C57BL/6 (upper-left panel) and NOD/scid mice (lower-left panel). Right panels: Cytb PCR analysis of 4T1, 4T1ρ0, and tumor sublines from orthotopic primary and metastatic tumors (upper-right panel, 4T1ρ0MFP, 4T1ρ0MFPL) and s.c. primary and metastatic tumors (4T1ρ0SC, 4T1ρ0SCL) that form in Balb/c mice.
(B) Left panels: sequence analysis of the polymorphic region (9,817–9,836 C57BL/6 reference NC_005089.1) of the mitochondrial tRNAArg gene from C57BL/6 and NOD/scid mice and from s.c. tumors derived from B16ρo cells grown in C57BL/6 and NOD/scid mice. Right panels: comparable sequence analysis of the mitochondrial tRNAArg gene from Balb/c mice and from a s.c. tumor derived from 4T1ρ0 cells grown in Balb/c mice. A summary table is presented.
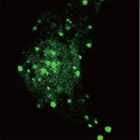
(C) COI immunocytochemical staining (green) of parental and ρ0 cells and individual sublines from ρ0 cells. Nuclei were stained with Hoechst 33342 (blue). Scale bar, 10 μm.
Figure 3
Parental 4T1- and 4T1ρ0-Derived Cell Lines Differ in Morphology and Phenotype
(A) 4T1 and derived sublines were evaluated using light microscopy.
(B) Sublines were stained with EtBr and MitoTracker Red, and confocal microscopy was used to identify yellow (EtBr) and red (MitoTracker Red) fluorescence. Nuclei were stained with Hoechst 33342 (blue). The percentage of cells with (upper-right quadrant) and without (left quadrants) mtDNA was evaluated by flow cytometry.
(C) Sublines were incubated with AO (red) to visualize acidic vacuoles and with Hoechst 33342 to show nuclei (blue). Cells were also probed by WB for LC3B-I/II, p62, Parkin, and BNIP3 with actin as loading control. Bafilomycin A treatment (20 nM, 16 hr) was included in the LC3BII analysis to determine autophagic flux.
(D) Sublines were incubated with E-cadherin (green) and vimentin (red) and counterstained with Hoechst 33342 and inspected by confocal microscopy.
Figure 4
TEM Analysis of 4T1ρ0 Sublines Shows Mitochondrial Ultrastructural Differences
4T1 cells and derived sublines were grown on coverslips, processed for TEM, and examined using TEM. The lower graphs indicate percent mitochondria with visible cristae (left) and percent mitochondria with ring-like cristae (right) for each subline. The percentage of mitochondria with visible cristae in 4T1 cells was set as 100%, the percentage of mitochondria with ring-like cristae in 4T1ρ0 cells set as 100%. Data are from three independent experiments, and the results are expressed as mean ± SD. The symbol ∗ denotes significant differences with p < 0.05.
Figure 5
Bioenergetic Properties of 4T1ρ0 Sublines
4T1 cells and derived sublines were assessed for glucose uptake (A), lactate production (B), and ATP level (C). Mitochondrial superoxide generation was evaluated using MitoSOX (D), cytosolic hydrogen peroxide with DCF (E), and ΔΨm using TMRM (F). (G) Cells were evaluated for routine, leak, net (R–L), and uncoupled (ETS) respiration using an Oxygraph respirometer. (H) Cells were permeabilized with digitonin and evaluated for respiration at the presence of substrates specific for CI and CII. Data are from three independent experiments, and the results are expressed as mean ± SD. The symbol ∗ denotes significant differences with p < 0.05.
Figure 6
Mitochondrial DNA Content and Transcriptional Activity of 4T1ρ0 Sublines
(A) 4T1 cells and derived sublines were evaluated for mtDNA/nDNA ratio using qPCR and specific primers ( Supplemental Information ). Analyses were performed using cells maintained in culture for a short period of time (first analysis), 1 month (second analysis), and 4 months (third analysis). Sublines were also evaluated for the level of RC transcripts encoded by mtDNA (B) and nDNA (C) and for transcripts of mitochondrial regulatory genes (D) using qPCR and specific primers ( Supplemental Information ). Data are from three independent experiments, and the results are expressed as mean ± SD. The symbol ∗ denotes significant differences with p < 0.05.
Figure 7
Mitochondrial Protein Synthesis, Respiratory Complex Formation, and Supercomplex Assembly in 4T1ρ0 Sublines
(A) 4T1 cells and derived sublines were evaluated for newly synthesized proteins using the Clik-iT AHA kit. Sublines were assessed for CS (B), SDH (C), and SQR activity (D) as detailed in Experimental Procedures , as well as for expression of specific proteins using WB (E). Tubulin was used as a loading control. (F) The mitochondrial fraction was lysed in the presence of digitonin and subjected to NBGE. Specific subunits of individual complexes were detected using the antibodies shown. HSP60 was used as a loading control. The level of expression of the individual bands representing RCs, subcomplexes, and SCs was evaluated by densitometry relative to HSP60. Data are from three independent experiments, and the results are expressed as mean ± SD. The symbol ∗ denotes significant differences with p < 0.05.
Highlights
- •Tumor cells lacking mtDNA form tumors only after acquiring host mtDNA
- •Tumor microenvironment instructs stepwise recovery of respiration
- •Recovery of mitochondrial function aligns with efficient tumor formation
- •Functional respirasome and complex II assembly occur in metastatic cells
Summary
We report that tumor cells without mitochondrial DNA (mtDNA) show delayed tumor growth, and that tumor formation is associated with acquisition of mtDNA from host cells. This leads to partial recovery of mitochondrial function in cells derived from primary tumors grown from cells without mtDNA and a shorter lag in tumor growth. Cell lines from circulating tumor cells showed further recovery of mitochondrial respiration and an intermediate lag to tumor growth, while cells from lung metastases exhibited full restoration of respiratory function and no lag in tumor growth. Stepwise assembly of mitochondrial respiratory (super)complexes was correlated with acquisition of respiratory function. Our findings indicate horizontal transfer of mtDNA from host cells in the tumor microenvironment to tumor cells with compromised respiratory function to re-establish respiration and tumor-initiating efficacy. These results suggest pathophysiological processes for overcoming mtDNA damage and support the notion of high plasticity of malignant cells.