Article preview View full access options

Mitochondrial ROS regulate thermogenic energy expenditure and sulfenylation of UCP1

Journal name:
Nature
Volume:
532,
Pages:
112–116
Date published:
DOI:
doi:10.1038/nature17399
Received
Accepted
Published online

Brown and beige adipose tissues can dissipate chemical energy as heat through thermogenic respiration, which requires uncoupling protein 1 (UCP1)1, 2. Thermogenesis from these adipocytes can combat obesity and diabetes3, encouraging investigation of factors that control UCP1-dependent respiration in vivo. Here we show that acutely activated thermogenesis in brown adipose tissue is defined by a substantial increase in levels of mitochondrial reactive oxygen species (ROS). Remarkably, this process supports in vivo thermogenesis, as pharmacological depletion of mitochondrial ROS results in hypothermia upon cold exposure, and inhibits UCP1-dependent increases in whole-body energy expenditure. We further establish that thermogenic ROS alter the redox status of cysteine thiols in brown adipose tissue to drive increased respiration, and that Cys253 of UCP1 is a key target. UCP1 Cys253 is sulfenylated during thermogenesis, while mutation of this site desensitizes the purine-nucleotide-inhibited state of the carrier to adrenergic activation and uncoupling. These studies identify mitochondrial ROS induction in brown adipose tissue as a mechanism that supports UCP1-dependent thermogenesis and whole-body energy expenditure, which opens the way to improved therapeutic strategies for combating metabolic disorders.

At a glance

Figures

left
  1. Increased BAT mitochondrial ROS levels support UCP1-dependent thermogenesis in vivo.
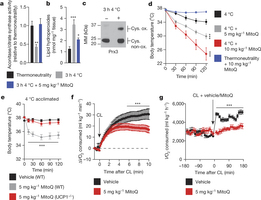
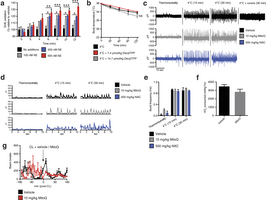
    Figure 1: Increased BAT mitochondrial ROS levels support UCP1-dependent thermogenesis in vivo.

    ac, Effect of acute cold exposure on in vivo BAT (a) mitochondrial superoxide-dependent inactivation of mitochondrial aconitase (n = 5; 5 mg kg−1 MitoQ n = 4), (b) lipid hydroperoxide content (n = 5), and (c) mitochondrial hydrogen-peroxide-dependent oxidation of Prx3. Oxidized Prx3 was assessed using the redox gel shift method described in Methods. MM, molecular mass. Cys. ox., cysteine oxidation. For uncropped scans see Supplementary Figs 1–3. d, Effect of i.p. MitoQ on core body temperature after acute cold exposure (n = 10). e, Effect of i.p. MitoQ on core body temperature of WT and UCP1−/− mice after 4 °C acclimation (n = 10; UCP1−/− n = 8). f, Oxygen consumed acutely before and after i.p. CL ± MitoQ (n = 5). g, Oxygen consumed 3 h before and after i.p. CL ± MitoQ (n = 8). Data are mean ± s.e.m. of at least four mouse replicates. *P < 0.05, ***P < 0.001 (two-tailed Student’s t-test for pairwise comparisons, one-way/two-way analysis of variance (ANOVA) for multiple comparisons involving one/two independent variables).

  2. BAT mitochondrial ROS during thermogenesis drives oxidation of cellular and mitochondrial thiols.
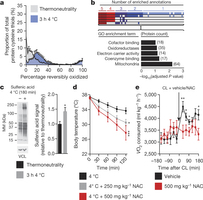
    Figure 2: BAT mitochondrial ROS during thermogenesis drives oxidation of cellular and mitochondrial thiols.

    a, Distribution of percentage reversible oxidation status of BAT protein thiols ± acute cold exposure. b, Pathway analysis of BAT proteins containing cysteine residues sensitive to substantial oxidation (>10% shift in oxidation status) upon cold exposure. Top: proteins clustered according to shared GO enrichment terms. Bottom: significantly enriched pathways. c, Immunodetection of protein sulfenic acid levels in BAT ± acute cold exposure (n = 4) d, Effect of i.p. NAC on core body temperature after acute cold exposure (n = 8; 500 mg kg−1 NAC n = 7). e, Oxygen consumed 3 h before and after i.p. CL ± NAC (control n = 12; NAC n = 9). VCL, vinculin. Data are mean ± s.e.m. of at least four mouse replicates. *P < 0.05, **P < 0.01, ***P < 0.001 (two-tailed Student’s t-test for pairwise comparisons, one-way/two-way ANOVA for multiple comparisons involving one/two independent variables).

  3. BAT mitochondrial ROS oxidatively modify a cysteine residue on UCP1 and support UCP1-dependent leak respiration.
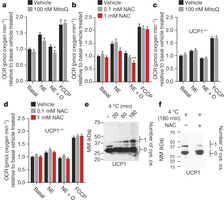
    Figure 3: BAT mitochondrial ROS oxidatively modify a cysteine residue on UCP1 and support UCP1-dependent leak respiration.

    a, b, OCR of brown adipocytes ± noradrenaline (NE) stimulation + oligomycin to determine leak respiration ± (a) MitoQ (n = 10) or (b) NAC (n = 8; 0.1 mM NAC n = 7). c, d, OCR of primary UCP1−/− adipocytes ± noradrenaline stimulation + oligomycin ± (c) MitoQ (n = 10) or (d) NAC (n = 10). e, f, Cys-redox immunoblot of BAT UCP1 (e) after a time course of acute cold exposure, and (f) after acute cold exposure ± 500 mg kg−1 NAC. FCCP, carbonyl cyanide-p-trifluoromethoxyphenylhydrazone. Data are mean ± s.e.m. of at least seven cellular replicates. *P < 0.05, **P < 0.01 (two-tailed Student’s t-test for pairwise comparisons, one-way ANOVA for multiple comparisons).

  4. UCP1 Cys253 is sulfenylated during thermogenesis and sensitizes UCP1 to adrenergic activation.
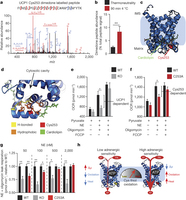
    Figure 4: UCP1 Cys253 is sulfenylated during thermogenesis and sensitizes UCP1 to adrenergic activation.

    a, MS2 spectrum of dimedone-labelled UCP1 Cys253 peptide indicating sulfenylation of this site during thermogenesis. Fragment ions that span the dimedone-alkylated cysteine are highlighted in the peptide sequence. C#, dimedone-labelled cysteine; M*, oxidized methionine. b, Quantification of dimedone-labelled UCP1 Cys253 relative to the NEM-alkylated form (n = 5). c, d, Structure of (c) human UCP1 modelled on the AAC crystal structure and (d) Cys253 in a hydrophobic pocket between two matrix facing helices. IMS, intermembrane space. e, f, Basal, maximal, and UCP1-dependent OCR of UCP1−/− brown adipocytes ± transduction with (e) WT UCP1 (WT n = 7; UCP1−/− n = 6) or (f) UCP1 C253A (WT n = 17; C253A n = 19). KO, knockout. g, UCP1-dependent leak respiration after stimulation by various concentrations of noradrenaline (50 nM noradrenaline n = 9; 100 nM noradrenaline n = 7; 500 nM noradrenaline n = 8; 2,000 nM noradrenaline n =  6). Comparison of UCP1 WT and C253A indicates that degree of UCP1 inhibition by C253A is inversely correlated with noradrenaline concentration (n = 19; 100 nM WT noradrenaline; n = 17,500 nM noradrenaline n = 18; 2,000 nM noradrenaline n = 10). j, A model of sensitization of UCP1-mediated uncoupling by mitochondrial ROS. Data are mean ± s.e.m. of at least five mouse replicates or cell replicates for respirometry experiments. *P < 0.05, **P < 0.01 (two-tailed Student’s t-test for pairwise comparisons).

  5. Assessing superoxide in brown adipocytes and effect of mitochondria-targeted compounds on shivering, body temperature, and movement.
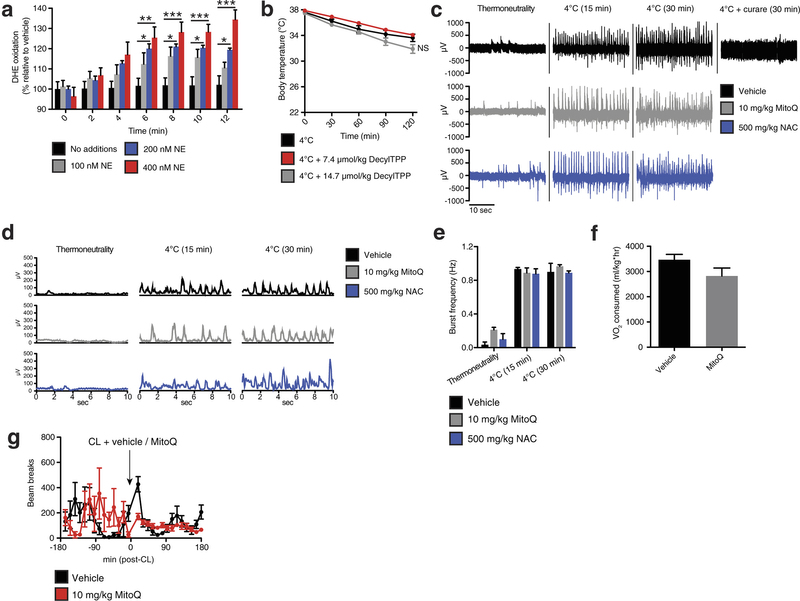
    Extended Data Fig. 1: Assessing superoxide in brown adipocytes and effect of mitochondria-targeted compounds on shivering, body temperature, and movement.

    a, Noradrenaline stimulates superoxide-dependent oxidation of DHE in primary brown adipocytes (n = 5). b, Effect of i.p. decyl-TPP on core body temperature after acute cold exposure (n = 10). c, d, Representative (c) raw and (d) root mean square mouse EMG traces at thermoneutrality and after acute cold exposure ± MitoQ, NAC, or curare (0.3 mg kg−1). e, Quantification of muscle burst frequency as determined by EMG at thermoneutrality and after acute cold exposure ± MitoQ or NAC (n = 3). f, Absolute oxygen consumed immediately before acute CL treatment described in Fig. 1f (n = 5). g, Effect of i.p. CL ± MitoQ on movement as assessed by number of beam breaks (n = 8). NS, not significant. Data are mean ± s.e.m. of at least three replicates. *P < 0.05, **P < 0.01, ***P < 0.001 (two-tailed Student’s t-test for pairwise comparisons, one-way ANOVA for multiple comparisons, two-way ANOVA for multiple comparisons involving two independent variables).

  6. Assessing thiol redox status in vivo and the effect of NAC on movement.
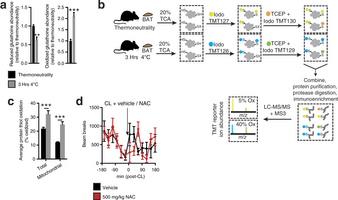
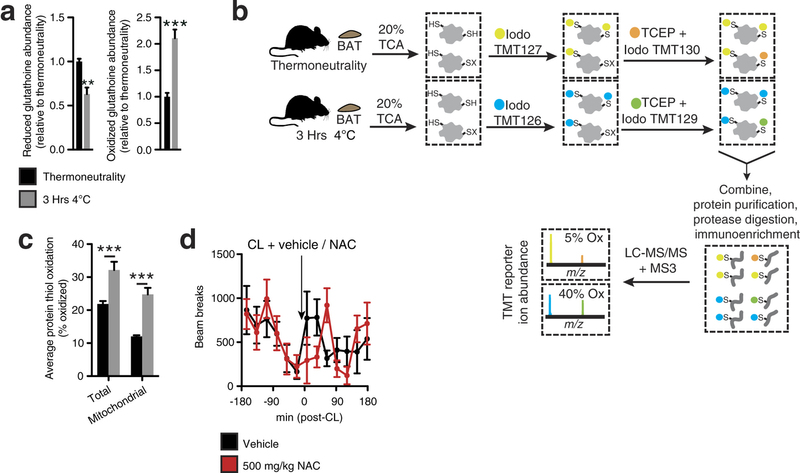
    Extended Data Fig. 2: Assessing thiol redox status in vivo and the effect of NAC on movement.

    a, Mass spectrometric quantification of BAT-reduced and -oxidized glutathione at thermoneutrality and after acute cold exposure (n = 5). b, Scheme for quantitative assessment of protein thiol redox status by ratiometric labelling of BAT protein cysteine thiols. In vivo BAT thiol status is stabilized by protein precipitation in 20% TCA49. Unmodified cysteine thiols are labelled with ‘light’ iodoTMT tags (126, 127, 128). After removal of light iodoTMT, reversibly modified protein thiols are reduced with TCEP in the presence of ‘heavy’ iodoTMT (129, 130, 131). Samples are combined and subjected to trypsin digestion. Ratiometric assessment of iodoTMT labelled peptides provides a quantitative profile of overall protein cysteine thiol redox status. c, Average percentage oxidation status of total BAT and BAT mitochondrial protein thiols at thermoneutrality and after acute cold exposure (n = 3). d, Effect of i.p. NAC on movement as assessed by number of beam breaks (vehicle, n = 11; NAC, n = 7). Data are mean ± s.e.m. of at least three replicates. *P < 0.05, ***P < 0.001 (two-tailed Student’s t-test for pairwise comparisons, one-way ANOVA for multiple comparisons, two-way ANOVA for multiple comparisons involving two independent variables).

  7. Assessing thermogenic gene expression, adrenergic response parameters, and strategy for determination of UCP1 cysteine thiol redox status.
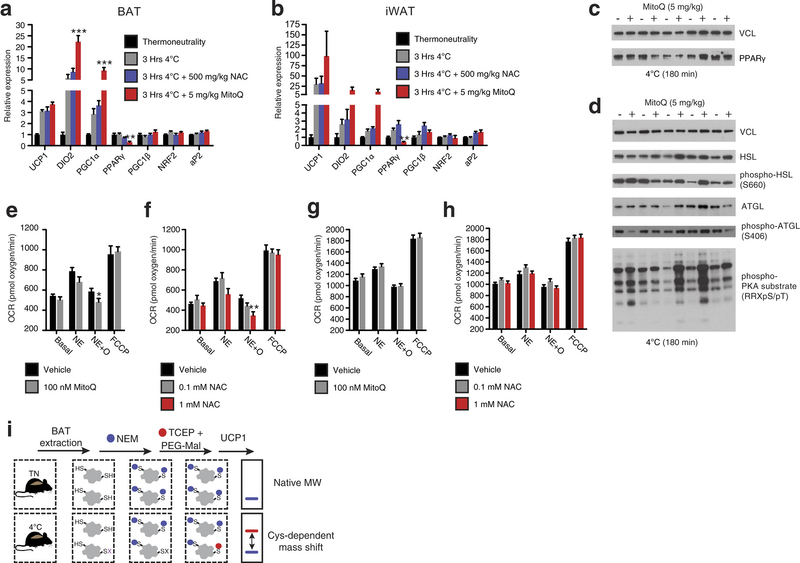
    Extended Data Fig. 3: Assessing thermogenic gene expression, adrenergic response parameters, and strategy for determination of UCP1 cysteine thiol redox status.

    a, b, Quantitative polymerase chain reaction (qPCR) analysis of mRNA expression of selected (a) BAT and (b) inguinal white adipose tissue (iWAT) genes ± cold exposure, ± MitoQ or NAC (n = 5). c, d, Immunoblot analysis of (c) PPAR-γ protein expression levels and (d) lipolytic phosphorylation cascade activation in BAT after cold exposure ± MitoQ. e, f, Raw OCR of primary brown adipocytes under basal conditions and after noradrenaline stimulation + oligomycin to determine leak respiration ± (e) MitoQ (n = 10) or (f) NAC (vehicle and 1 mM NAC, n = 8; 0.1 mM NAC, n = 7). g, h, OCR of primary brown adipocytes lacking UCP1 under basal conditions and after noradrenaline stimulation + oligomycin ± (g) MitoQ (n = 10) and (h) NAC (n = 10). i, Cys-redox mass shift strategy. After in vivo interventions, mouse BAT is excised and unmodified protein thiols are labelled with NEM, after which reversibly oxidized thiols are chemically reduced and labelled with polyethyleneglycol maleimide (PEG-Mal) allowing for determination of cysteine oxidation status on UCP1. Data are mean ± s.e.m. of at least five replicates. *P < 0.05, **P < 0.01 (two-tailed Student’s t-test for pairwise comparisons, one-way ANOVA for multiple comparisons, two-way ANOVA for multiple comparisons involving two independent variables).

  8. Assessing UCP1 reversible cysteine oxidation status in vivo by immunoblot and mass spectrometry.
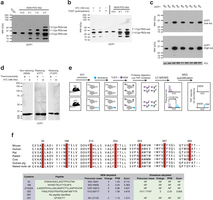
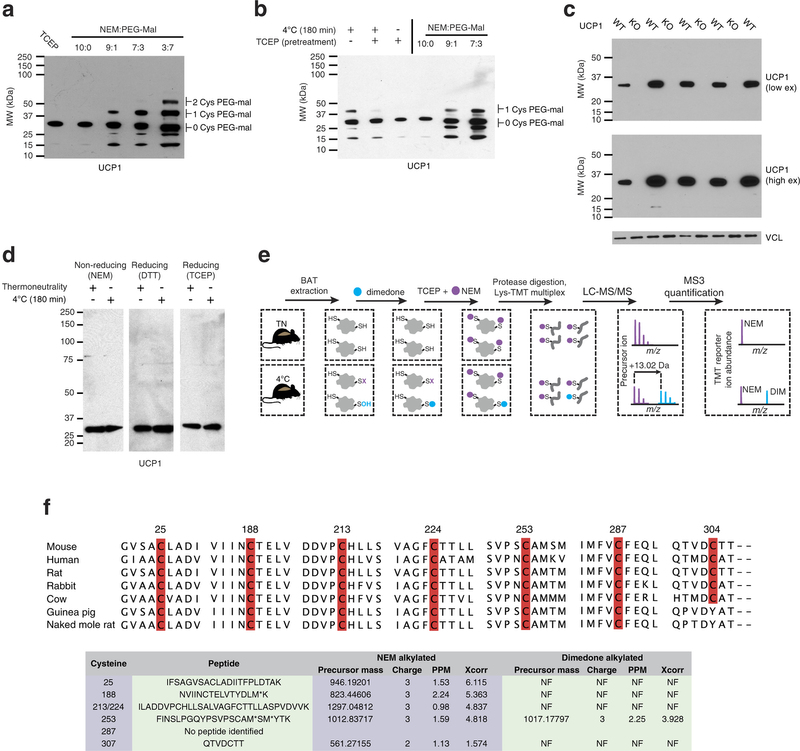
    Extended Data Fig. 4: Assessing UCP1 reversible cysteine oxidation status in vivo by immunoblot and mass spectrometry.

    a, Calibration of UCP1 cysteine gel shift immunoblot. Calibration of cysteine-dependent shifts by incubation of BAT protein with TCEP and different ratios of NEM and PEG-Mal indicates that a single PEG-mal labelling event shifts UCP1 by ~10 kDa above the native molecular mass. b, Calibration of UCP1 cysteine oxidation status indicates that the gel shift observed upon cold exposure (lane 1) is cysteine dependent, as TCEP pretreatment results in a loss of the shift (lane 2). In addition, the cysteine-dependent mass shift is due to a single oxidation event as determined by including the calibrating markers (lanes 4–6). c, Calibration of specificity of UCP1 antibody in BAT. d, Reducing and non-reducing SDS–PAGE analysis of UCP1 to monitor cysteine-dependent and -independent inter-protein interactions during acute cold exposure. e, Scheme for identification of sulfenylated cysteines on UCP1 by dimedone labelling and mass spectrometry. After acute cold exposure, BAT protein thiols are differentially alkylated with dimedone to selectively label sulfenylated thiols and NEM to label non-sulfenylated thiols. Samples are subjected to trypsin digestion, followed by Lys-TMT labelling, and MS quantification of UCP1 cysteine containing peptides in their dimedone and NEM alkylated forms. Two technical points should be noted in this strategy when interpreting relative quantitation of NEM and dimedone-alkylated peptides. First, these differently alkylated peptides may not necessarily ionize with the same efficiency. Second, NEM is reported to react with sulfenic acids albeit less efficiently than with free thiols50, which should be factored in when considering the order of addition of dimedone/NEM and potential underestimation of sulfenylation status. f, Top: amino-acid sequence alignment of UCP1 proteins highlighting the candidate cysteine residues contained within the mouse protein and their level of conservation across various species. Bottom: summary of MS determination of UCP1 cysteine sulfenylation status. Six of seven UCP1 cysteines were identified, with all but one being identified exclusively in the unmodified (NEM-alkylated state). Cys253 is identified as dimedone labelled, indicating that it is a site for sulfenylation.

  9. Structure of human UCP1 modelled on the AAC crystal structure including bound cardiolipin and sulfenylation of Cys253.
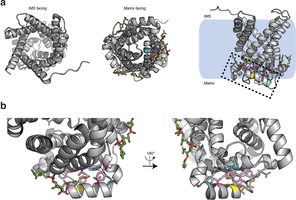
    Extended Data Fig. 5: Structure of human UCP1 modelled on the AAC crystal structure including bound cardiolipin and sulfenylation of Cys253.

    a, Entire UCP1 modelled structure including bound cardiolipin (green), and Cys253 in the oxidized sulfenic acid form. b, UCP1 region containing Cys253 in the oxidized sulfenic acid form. Cys253 localizes to a hydrophobic pocket between two matrix facing helices. Hydrophobic residues (pink) surround the Cys253 thiol, and a hydrogen bond between Arg238 and Glu261 (aqua) is proximal. These residues that stabilize interaction between the matrix facing helices are probably important for stabilization of the purine bound ‘c-state’ of the carrier. Two separate cardiolipin (green) binding domains are localized proximal to Cys253 within the UCP1 modelled structure.

  10. Assessing transduced UCP1 constructs, OCR, and sulfenylation in brown adipocytes.
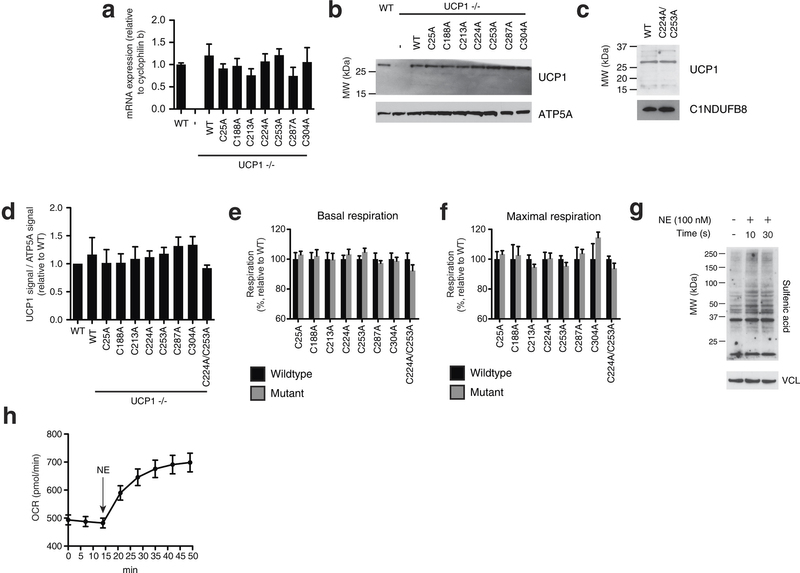
    Extended Data Fig. 6: Assessing transduced UCP1 constructs, OCR, and sulfenylation in brown adipocytes.

    a, Quantitative PCR analysis of UCP1 mRNA in WT, and UCP1−/− brown adipocytes transduced with WT and cysteine null UCP1 mutants (n = 4). b, Immunoblot of UCP1 protein in WT and UCP1−/− brown adipocytes transduced with WT and cysteine null UCP1 mutants. c, Immunoblot analysis of UCP1 protein in UCP1−/− brown adipocytes transduced with C224A/C253A double mutant compared with WT. d, Densitometry analysis of transduced UCP1 forms relative to WT across separate transduction experiments (n = 4; C224A/C253A n = 3). e, f, Summary of basal (e) and maximal (f) OCR of primary brown adipocytes containing cysteine-null UCP1 mutants. Raw OCR values provided in Extended Data Fig. 7. g, Immunodetection of protein sulfenic acid levels in primary brown adipocytes in the seconds after treatment with 100 nM noradrenaline. h, Time course of brown adipocyte OCR after stimulation with 100 nM noradrenaline (n = 12). Data are mean ± s.e.m. of at least three replicates.

  11. Assessing OCR under basal and FCCP-stimulated maximal respiration, and after noradrenaline stimulation + oligomycin in UCP1−/− primary brown adipocytes transduced with UCP1 cysteine null mutants.
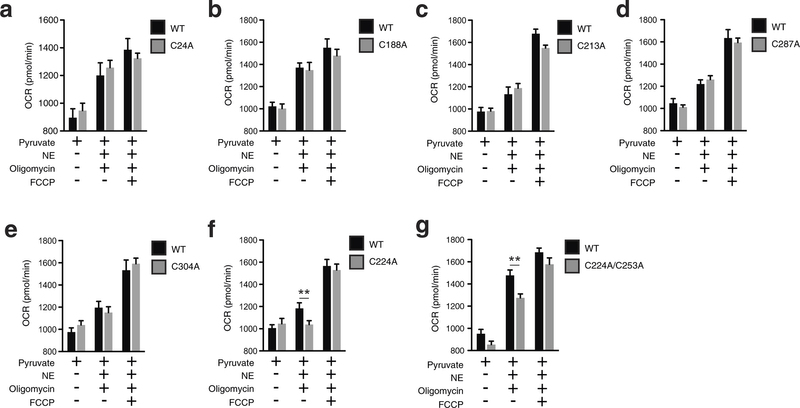
    Extended Data Fig. 7: Assessing OCR under basal and FCCP-stimulated maximal respiration, and after noradrenaline stimulation + oligomycin in UCP1−/− primary brown adipocytes transduced with UCP1 cysteine null mutants.

    a–g, Raw basal, maximal, and UCP1-dependent OCR from representative experiments of WT and UCP1−/− brown adipocytes transduced with (a) UCP1 C24A (WT n = 11; C24A n = 12), (b) C188A (n = 7), (c) UCP1 C213A (n = 19), (d) UCP1 C287A (WT n = 9; C287A n = 10), (e) UCP1 C304A (WT n = 7; C304A n = 10), (f) UCP1 C224A (WT n = 9; C224A n = 10), (g) UCP1 C224A/C253A (n = 8). Data are mean ± s.e.m. of at least seven replicates. **P < 0.01 (two-tailed Student’s t-test for pairwise comparisons).

  12. Assessing UCP1-dependent respiration and uncoupling following increasing degrees of adrenergic stimulus.
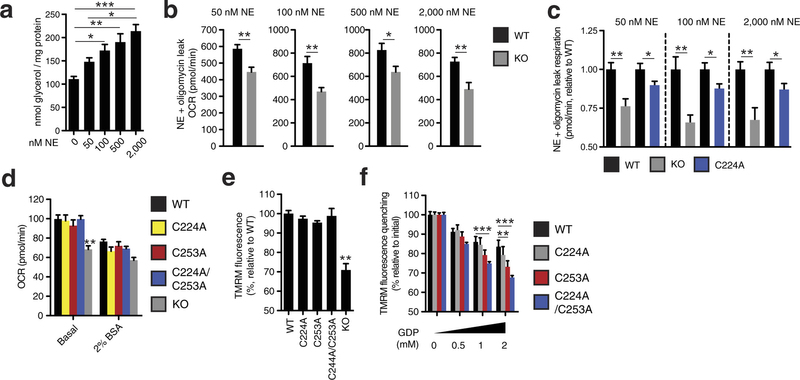
    Extended Data Fig. 8: Assessing UCP1-dependent respiration and uncoupling following increasing degrees of adrenergic stimulus.

    a, Glycerol release from brown adipocytes as an index of adrenergic stimulus and lipolysis in response to increasing concentrations of noradrenaline (n = 4; 0 and 2,000 nM noradrenaline n = 6). b, Representative raw noradrenaline + oligomycin leak OCR values in WT and UCP1−/− brown adipocytes after stimulation with a range of noradrenaline concentrations indicates that UCP1-dependent leak respiration is consistently ~25–35% of total leak OCR (50 nM n = 9; 100 nM n = 7; 500 nM n = 8; 2,000 nM n = 6). c, Assessment of UCP1-dependent leak respiration after stimulation by various concentrations of noradrenaline + oligomycin. Comparison of WT and UCP1−/− OCR (replotted data from Fig. 4 for comparison) indicates that UCP1-dependent respiration is consistently ~25–35% of leak respiration. Comparison of UCP1 WT and C224A indicates that the degree of UCP1 inhibition by C224A is relatively stable across various noradrenaline concentrations (n = 8; C224A 100 nM noradrenaline n = 9, 2,000 nM noradrenaline n = 14). d, Plasma-membrane-permeabilized OCR of brown adipocytes ± endogenous fatty-acid depletion with BSA (WT n = 30; KO n = 20; C224A n = 9; C253A n = 8; C224A/C253A n = 10). e, Comparison of UCP1-dependent uncoupling absent purine nucleotide inhibition in plasma-membrane-permeabilized brown adipocytes (n = 6; C224A/C253A, KO n = 4). f, Comparison of UCP1-dependent uncoupling after titration of GDP in permeabilized adipocytes containing WT UCP1, UCP1 C224A, C253A, and C224A/C253A (n = 6; C224A/C253A n = 12). Data are mean ± s.e.m. of at least four replicates. *P < 0.05, **P < 0.01, ***P < 0.001 (two-tailed Student’s t-test for pairwise comparisons, one-way ANOVA for multiple comparisons).

right

References

  1. Nicholls, D. G. The physiological regulation of uncoupling proteins. Biochim. Biophys. Acta 1757, 459–466 (2006)
  2. Divakaruni, A. S. & Brand, M. D. The regulation and physiology of mitochondrial proton leak. Physiology 26, 192205 (2011)
  3. Yoneshiro, T. et al. Recruited brown adipose tissue as an antiobesity agent in humans. J. Clin. Invest. 123, 34043408 (2013)
  4. Wu, J. et al. Beige adipocytes are a distinct type of thermogenic fat cell in mouse and human. Cell 150, 366376 (2012)
  5. Cox, A. G., Peskin, A. V., Paton, L. N., Winterbourn, C. C. & Hampton, M. B. Redox potential and peroxide reactivity of human peroxiredoxin 3. Biochemistry 48, 64956501 (2009)
  6. Rodriguez-Cuenca, S. et al. Consequences of long-term oral administration of the mitochondria-targeted antioxidant MitoQ to wild-type mice. Free Radic. Biol. Med. 48, 161172 (2010)
  7. Cannon, B. & Nedergaard, J. Nonshivering thermogenesis and its adequate measurement in metabolic studies. J. Exp. Biol. 214, 242253 (2011)
  8. Ukropec, J., Anunciado, R. P., Ravussin, Y., Hulver, M. W. & Kozak, L. P. UCP1-independent thermogenesis in white adipose tissue of cold-acclimated Ucp1−/− mice. J. Biol. Chem. 281, 3189431908 (2006)
  9. Himms-Hagen, J. et al. Effect of CL-316,243, a thermogenic beta 3-agonist, on energy balance and brown and white adipose tissues in rats. Am. J. Physiol. 266, R1371R1382 (1994)
  10. Collins, Y. et al. Mitochondrial redox signalling at a glance. J. Cell Sci. 125, 801806 (2012)
  11. Seo, Y. H. & Carroll, K. S. Profiling protein thiol oxidation in tumor cells using sulfenic acid-specific antibodies. Proc. Natl Acad. Sci. USA 106, 1616316168 (2009)
  12. Finkel, T. From sulfenylation to sulfhydration: what a thiolate needs to tolerate. Sci. Signal. 5, pe10 (2012)
  13. Atkuri, K. R., Mantovani, J. J., Herzenberg, L. A. & Herzenberg, L. A. N-Acetylcysteine—a safe antidote for cysteine/glutathione deficiency. Curr. Opin. Pharmacol. 7, 355359 (2007)
  14. Wikstrom, J. D. et al. Hormone-induced mitochondrial fission is utilized by brown adipocytes as an amplification pathway for energy expenditure. EMBO J. 33, 418436 (2014)
  15. Li, Y., Fromme, T., Schweizer, S., Schöttl, T. & Klingenspor, M. Taking control over intracellular fatty acid levels is essential for the analysis of thermogenic function in cultured primary brown and brite/beige adipocytes. EMBO Rep. 15, 10691076 (2014)
  16. Requejo, R. et al. Measuring mitochondrial protein thiol redox state. Methods Enzymol. 474, 123147 (2010)
  17. Martínez-Acedo, P., Gupta, V. & Carroll, K. S. Proteomic analysis of peptides tagged with dimedone and related probes. J. Mass Spectrom. 49, 257265 (2014)
  18. Nelson, K. J. et al. Use of dimedone-based chemical probes for sulfenic acid detection methods to visualize and identify labeled proteins. Methods Enzymol. 473, 95115 (2010)
  19. Pebay-Peyroula, E. et al. Structure of mitochondrial ADP/ATP carrier in complex with carboxyatractyloside. Nature 426, 3944 (2003)
  20. Fedorenko, A., Lishko, P. V. & Kirichok, Y. Mechanism of fatty-acid-dependent UCP1 uncoupling in brown fat mitochondria. Cell 151, 400413 (2012)
  21. Lee, Y., Willers, C., Kunji, E. R. & Crichton, P. G. Uncoupling protein 1 binds one nucleotide per monomer and is stabilized by tightly bound cardiolipin. Proc. Natl Acad. Sci. USA 112, 69736978 (2015)
  22. Ruprecht, J. J. et al. Structures of yeast mitochondrial ADP/ATP carriers support a domain-based alternating-access transport mechanism. Proc. Natl Acad. Sci. USA 111, E426E434 (2014)
  23. Modrianský, M., Murdza-Inglis, D. L., Patel, H. V., Freeman, K. B. & Garlid, K. D. Identification by site-directed mutagenesis of three arginines in uncoupling protein that are essential for nucleotide binding and inhibition. J. Biol. Chem. 272, 2475924762 (1997)
  24. Divakaruni, A. S., Humphrey, D. M. & Brand, M. D. Fatty acids change the conformation of uncoupling protein 1 (UCP1). J. Biol. Chem. 287, 3684536853 (2012)
  25. Arechaga, I. et al. Cysteine residues are not essential for uncoupling protein function. Biochem. J. 296, 693700 (1993)
  26. Echtay, K. S. et al. Superoxide activates mitochondrial uncoupling proteins. Nature 415, 9699 (2002)
  27. Silva, J. P. et al. SOD2 overexpression: enhanced mitochondrial tolerance but absence of effect on UCP activity. EMBO J. 24, 40614070 (2005)
  28. Mailloux, R. J., Adjeitey, C. N., Xuan, J. Y. & Harper, M. E. Crucial yet divergent roles of mitochondrial redox state in skeletal muscle vs. brown adipose tissue energetics. FASEB J. 26, 363375 (2012)
  29. Stuart, J. A., Harper, J. A., Brindle, K. M., Jekabsons, M. B. & Brand, M. D. A mitochondrial uncoupling artifact can be caused by expression of uncoupling protein 1 in yeast. Biochem. J. 356, 779789 (2001)
  30. Malingriaux, E. A. et al. Fatty acids are key in 4-hydroxy-2-nonenal-mediated activation of uncoupling proteins 1 and 2. PLoS ONE 8, e77786 (2013)
  31. Gospodarska, E., Nowialis, P. & Kozak, L. P. Mitochondrial turnover: a phenotype distinguishing brown adipocytes from interscapular brown adipose tissue and white adipose tissue. J. Biol. Chem. 290, 82438255 (2015)
  32. Hodges, M. R. et al. Defects in breathing and thermoregulation in mice with near-complete absence of central serotonin neurons. J. Neurosci. 28, 24952505 (2008)
  33. Chouchani, E. T. et al. Ischaemic accumulation of succinate controls reperfusion injury through mitochondrial ROS. Nature 515, 431435 (2014)
  34. Srere, P. A. Controls of citrate synthase activity. Life Sci. 15, 16951710 (1974)
  35. Hurd, T. R. et al. Inactivation of pyruvate dehydrogenase kinase 2 by mitochondrial reactive oxygen species. J. Biol. Chem. 287, 3515335160 (2012)
  36. Townsend, M. K. et al. Reproducibility of metabolomic profiles among men and women in 2 large cohort studies. Clin. Chem. 59, 16571667 (2013)
  37. Huang, D. W., Sherman, B. T. & Lempicki, R. A. Systematic and integrative analysis of large gene lists using DAVID bioinformatics resources. Nature Protocols 4, 4457 (2008)
  38. Klomsiri, C. et al. Use of dimedone-based chemical probes for sulfenic acid detection evaluation of conditions affecting probe incorporation into redox-sensitive proteins. Methods Enzymol. 473, 7794 (2010)
  39. Kazak, L. et al. A creatine-driven substrate cycle enhances energy expenditure and thermogenesis in beige fat. Cell 163, 643655 (2015)
  40. Eng, J. K., McCormack, A. L. & Yates, J. R. An approach to correlate tandem mass spectral data of peptides with amino acid sequences in a protein database. J. Am. Soc. Mass Spectrom. 5, 976989 (1994)
  41. Elias, J. E. & Gygi, S. P. Target-decoy search strategy for increased confidence in large-scale protein identifications by mass spectrometry. Nature Methods 4, 207214 (2007)
  42. Huttlin, E. L. et al. A tissue-specific atlas of mouse protein phosphorylation and expression. Cell 143, 11741189 (2010)
  43. McAlister, G. C. et al. MultiNotch MS3 enables accurate, sensitive, and multiplexed detection of differential expression across cancer cell line proteomes. Anal. Chem. 86, 71507158 (2014)
  44. Kir, S. et al. Tumour-derived PTH-related protein triggers adipose tissue browning and cancer cachexia. Nature 513, 100104 (2014)
  45. Edgar, R. C. MUSCLE: multiple sequence alignment with high accuracy and high throughput. Nucleic Acids Res. 32, 17921797 (2004)
  46. Waterhouse, A. M., Procter, J. B., Martin, D. M., Clamp, M. & Barton, G. J. Jalview Version 2—a multiple sequence alignment editor and analysis workbench. Bioinformatics 25, 11891191 (2009)
  47. Crichton, P. G. et al. Trends in thermostability provide information on the nature of substrate, inhibitor, and lipid interactions with mitochondrial carriers. J. Biol. Chem. 290, 82068217 (2015)
  48. Davidson, S. M., Yellon, D. & Duchen, M. R. Assessing mitochondrial potential, calcium, and redox state in isolated mammalian cells using confocal microscopy. Methods Mol. Biol. 372, 421430 (2007)
  49. Held, J. M. et al. Targeted quantitation of site-specific cysteine oxidation in endogenous proteins using a differential alkylation and multiple reaction monitoring mass spectrometry approach. Mol. Cell. Proteom. 9, 14001410 (2010)
  50. Reisz, J. A., Bechtold, E., King, S. B., Poole, L. B. & Furdui, C. M. Thiol-blocking electrophiles interfere with labeling and detection of protein sulfenic acids. FEBS J. 280, 61506161 (2013)

Download references

Author information

  1. These authors contributed equally to this work.

    • Edward T. Chouchani &
    • Lawrence Kazak

Affiliations

  1. Dana-Farber Cancer Institute, Harvard Medical School, Boston, Massachusetts 02115, USA

    • Edward T. Chouchani,
    • Lawrence Kazak,
    • Gina Z. Lu,
    • Dina Laznik-Bogoslavski &
    • Bruce M. Spiegelman
  2. Department of Cell Biology, Harvard Medical School, Boston, Massachusetts 02115, USA

    • Edward T. Chouchani,
    • Lawrence Kazak,
    • Mark P. Jedrychowski,
    • Gina Z. Lu,
    • Brian K. Erickson,
    • John Szpyt,
    • Steve P. Gygi &
    • Bruce M. Spiegelman
  3. Broad Institute of Harvard and MIT, Cambridge, Massachusetts 02142, USA

    • Kerry A. Pierce &
    • Clary B. Clish
  4. Department of Neurology, Harvard Medical School, Boston, Massachusetts 02215, USA

    • Ramalingam Vetrivelan
  5. MRC Mitochondrial Biology Unit, Hills Road, Cambridge CB2 0XY, UK

    • Alan J. Robinson

Contributions

E.T.C. designed research, performed biochemical, cellular, and in vivo experiments, analysed data, and co-wrote the paper. L.K. designed and performed cellular and mutagenesis experiments. M.P.J. and K.A.P. performed and analysed data from mass spectrometric experiments. G.Z.L. performed cellular experiments. C.B.C. and S.P.G. oversaw mass spectrometric experiments. A.J.R. designed and performed structural modelling. E.T.C. and B.M.S. directed the research and co-wrote the paper, with assistance from all other authors.

Competing financial interests

The authors declare no competing financial interests.

Corresponding author

Correspondence to:

Author details

Extended data figures and tables

Extended Data Figures

  1. Extended Data Figure 1: Assessing superoxide in brown adipocytes and effect of mitochondria-targeted compounds on shivering, body temperature, and movement. (219 KB)

    a, Noradrenaline stimulates superoxide-dependent oxidation of DHE in primary brown adipocytes (n = 5). b, Effect of i.p. decyl-TPP on core body temperature after acute cold exposure (n = 10). c, d, Representative (c) raw and (d) root mean square mouse EMG traces at thermoneutrality and after acute cold exposure ± MitoQ, NAC, or curare (0.3 mg kg−1). e, Quantification of muscle burst frequency as determined by EMG at thermoneutrality and after acute cold exposure ± MitoQ or NAC (n = 3). f, Absolute oxygen consumed immediately before acute CL treatment described in Fig. 1f (n = 5). g, Effect of i.p. CL ± MitoQ on movement as assessed by number of beam breaks (n = 8). NS, not significant. Data are mean ± s.e.m. of at least three replicates. *P < 0.05, **P < 0.01, ***P < 0.001 (two-tailed Student’s t-test for pairwise comparisons, one-way ANOVA for multiple comparisons, two-way ANOVA for multiple comparisons involving two independent variables).

  2. Extended Data Figure 2: Assessing thiol redox status in vivo and the effect of NAC on movement. (185 KB)

    a, Mass spectrometric quantification of BAT-reduced and -oxidized glutathione at thermoneutrality and after acute cold exposure (n = 5). b, Scheme for quantitative assessment of protein thiol redox status by ratiometric labelling of BAT protein cysteine thiols. In vivo BAT thiol status is stabilized by protein precipitation in 20% TCA49. Unmodified cysteine thiols are labelled with ‘light’ iodoTMT tags (126, 127, 128). After removal of light iodoTMT, reversibly modified protein thiols are reduced with TCEP in the presence of ‘heavy’ iodoTMT (129, 130, 131). Samples are combined and subjected to trypsin digestion. Ratiometric assessment of iodoTMT labelled peptides provides a quantitative profile of overall protein cysteine thiol redox status. c, Average percentage oxidation status of total BAT and BAT mitochondrial protein thiols at thermoneutrality and after acute cold exposure (n = 3). d, Effect of i.p. NAC on movement as assessed by number of beam breaks (vehicle, n = 11; NAC, n = 7). Data are mean ± s.e.m. of at least three replicates. *P < 0.05, ***P < 0.001 (two-tailed Student’s t-test for pairwise comparisons, one-way ANOVA for multiple comparisons, two-way ANOVA for multiple comparisons involving two independent variables).

  3. Extended Data Figure 3: Assessing thermogenic gene expression, adrenergic response parameters, and strategy for determination of UCP1 cysteine thiol redox status. (220 KB)

    a, b, Quantitative polymerase chain reaction (qPCR) analysis of mRNA expression of selected (a) BAT and (b) inguinal white adipose tissue (iWAT) genes ± cold exposure, ± MitoQ or NAC (n = 5). c, d, Immunoblot analysis of (c) PPAR-γ protein expression levels and (d) lipolytic phosphorylation cascade activation in BAT after cold exposure ± MitoQ. e, f, Raw OCR of primary brown adipocytes under basal conditions and after noradrenaline stimulation + oligomycin to determine leak respiration ± (e) MitoQ (n = 10) or (f) NAC (vehicle and 1 mM NAC, n = 8; 0.1 mM NAC, n = 7). g, h, OCR of primary brown adipocytes lacking UCP1 under basal conditions and after noradrenaline stimulation + oligomycin ± (g) MitoQ (n = 10) and (h) NAC (n = 10). i, Cys-redox mass shift strategy. After in vivo interventions, mouse BAT is excised and unmodified protein thiols are labelled with NEM, after which reversibly oxidized thiols are chemically reduced and labelled with polyethyleneglycol maleimide (PEG-Mal) allowing for determination of cysteine oxidation status on UCP1. Data are mean ± s.e.m. of at least five replicates. *P < 0.05, **P < 0.01 (two-tailed Student’s t-test for pairwise comparisons, one-way ANOVA for multiple comparisons, two-way ANOVA for multiple comparisons involving two independent variables).

  4. Extended Data Figure 4: Assessing UCP1 reversible cysteine oxidation status in vivo by immunoblot and mass spectrometry. (354 KB)

    a, Calibration of UCP1 cysteine gel shift immunoblot. Calibration of cysteine-dependent shifts by incubation of BAT protein with TCEP and different ratios of NEM and PEG-Mal indicates that a single PEG-mal labelling event shifts UCP1 by ~10 kDa above the native molecular mass. b, Calibration of UCP1 cysteine oxidation status indicates that the gel shift observed upon cold exposure (lane 1) is cysteine dependent, as TCEP pretreatment results in a loss of the shift (lane 2). In addition, the cysteine-dependent mass shift is due to a single oxidation event as determined by including the calibrating markers (lanes 4–6). c, Calibration of specificity of UCP1 antibody in BAT. d, Reducing and non-reducing SDS–PAGE analysis of UCP1 to monitor cysteine-dependent and -independent inter-protein interactions during acute cold exposure. e, Scheme for identification of sulfenylated cysteines on UCP1 by dimedone labelling and mass spectrometry. After acute cold exposure, BAT protein thiols are differentially alkylated with dimedone to selectively label sulfenylated thiols and NEM to label non-sulfenylated thiols. Samples are subjected to trypsin digestion, followed by Lys-TMT labelling, and MS quantification of UCP1 cysteine containing peptides in their dimedone and NEM alkylated forms. Two technical points should be noted in this strategy when interpreting relative quantitation of NEM and dimedone-alkylated peptides. First, these differently alkylated peptides may not necessarily ionize with the same efficiency. Second, NEM is reported to react with sulfenic acids albeit less efficiently than with free thiols50, which should be factored in when considering the order of addition of dimedone/NEM and potential underestimation of sulfenylation status. f, Top: amino-acid sequence alignment of UCP1 proteins highlighting the candidate cysteine residues contained within the mouse protein and their level of conservation across various species. Bottom: summary of MS determination of UCP1 cysteine sulfenylation status. Six of seven UCP1 cysteines were identified, with all but one being identified exclusively in the unmodified (NEM-alkylated state). Cys253 is identified as dimedone labelled, indicating that it is a site for sulfenylation.

  5. Extended Data Figure 5: Structure of human UCP1 modelled on the AAC crystal structure including bound cardiolipin and sulfenylation of Cys253. (312 KB)

    a, Entire UCP1 modelled structure including bound cardiolipin (green), and Cys253 in the oxidized sulfenic acid form. b, UCP1 region containing Cys253 in the oxidized sulfenic acid form. Cys253 localizes to a hydrophobic pocket between two matrix facing helices. Hydrophobic residues (pink) surround the Cys253 thiol, and a hydrogen bond between Arg238 and Glu261 (aqua) is proximal. These residues that stabilize interaction between the matrix facing helices are probably important for stabilization of the purine bound ‘c-state’ of the carrier. Two separate cardiolipin (green) binding domains are localized proximal to Cys253 within the UCP1 modelled structure.

  6. Extended Data Figure 6: Assessing transduced UCP1 constructs, OCR, and sulfenylation in brown adipocytes. (155 KB)

    a, Quantitative PCR analysis of UCP1 mRNA in WT, and UCP1−/− brown adipocytes transduced with WT and cysteine null UCP1 mutants (n = 4). b, Immunoblot of UCP1 protein in WT and UCP1−/− brown adipocytes transduced with WT and cysteine null UCP1 mutants. c, Immunoblot analysis of UCP1 protein in UCP1−/− brown adipocytes transduced with C224A/C253A double mutant compared with WT. d, Densitometry analysis of transduced UCP1 forms relative to WT across separate transduction experiments (n = 4; C224A/C253A n = 3). e, f, Summary of basal (e) and maximal (f) OCR of primary brown adipocytes containing cysteine-null UCP1 mutants. Raw OCR values provided in Extended Data Fig. 7. g, Immunodetection of protein sulfenic acid levels in primary brown adipocytes in the seconds after treatment with 100 nM noradrenaline. h, Time course of brown adipocyte OCR after stimulation with 100 nM noradrenaline (n = 12). Data are mean ± s.e.m. of at least three replicates.

  7. Extended Data Figure 7: Assessing OCR under basal and FCCP-stimulated maximal respiration, and after noradrenaline stimulation + oligomycin in UCP1−/− primary brown adipocytes transduced with UCP1 cysteine null mutants. (118 KB)

    a–g, Raw basal, maximal, and UCP1-dependent OCR from representative experiments of WT and UCP1−/− brown adipocytes transduced with (a) UCP1 C24A (WT n = 11; C24A n = 12), (b) C188A (n = 7), (c) UCP1 C213A (n = 19), (d) UCP1 C287A (WT n = 9; C287A n = 10), (e) UCP1 C304A (WT n = 7; C304A n = 10), (f) UCP1 C224A (WT n = 9; C224A n = 10), (g) UCP1 C224A/C253A (n = 8). Data are mean ± s.e.m. of at least seven replicates. **P < 0.01 (two-tailed Student’s t-test for pairwise comparisons).

  8. Extended Data Figure 8: Assessing UCP1-dependent respiration and uncoupling following increasing degrees of adrenergic stimulus. (140 KB)

    a, Glycerol release from brown adipocytes as an index of adrenergic stimulus and lipolysis in response to increasing concentrations of noradrenaline (n = 4; 0 and 2,000 nM noradrenaline n = 6). b, Representative raw noradrenaline + oligomycin leak OCR values in WT and UCP1−/− brown adipocytes after stimulation with a range of noradrenaline concentrations indicates that UCP1-dependent leak respiration is consistently ~25–35% of total leak OCR (50 nM n = 9; 100 nM n = 7; 500 nM n = 8; 2,000 nM n = 6). c, Assessment of UCP1-dependent leak respiration after stimulation by various concentrations of noradrenaline + oligomycin. Comparison of WT and UCP1−/− OCR (replotted data from Fig. 4 for comparison) indicates that UCP1-dependent respiration is consistently ~25–35% of leak respiration. Comparison of UCP1 WT and C224A indicates that the degree of UCP1 inhibition by C224A is relatively stable across various noradrenaline concentrations (n = 8; C224A 100 nM noradrenaline n = 9, 2,000 nM noradrenaline n = 14). d, Plasma-membrane-permeabilized OCR of brown adipocytes ± endogenous fatty-acid depletion with BSA (WT n = 30; KO n = 20; C224A n = 9; C253A n = 8; C224A/C253A n = 10). e, Comparison of UCP1-dependent uncoupling absent purine nucleotide inhibition in plasma-membrane-permeabilized brown adipocytes (n = 6; C224A/C253A, KO n = 4). f, Comparison of UCP1-dependent uncoupling after titration of GDP in permeabilized adipocytes containing WT UCP1, UCP1 C224A, C253A, and C224A/C253A (n = 6; C224A/C253A n = 12). Data are mean ± s.e.m. of at least four replicates. *P < 0.05, **P < 0.01, ***P < 0.001 (two-tailed Student’s t-test for pairwise comparisons, one-way ANOVA for multiple comparisons).

Supplementary information

PDF files

  1. Supplementary Figures (512 KB)

    This file contains Supplementary Figures 1-3, which contain the uncropped scans with size markers indications for Figures 1-3 and Extended Data Figure 3 (1); Extended Data Figure 4 (2) and Extended Data Figure 6 (3).

  2. Supplementary Data (3 MB)

    This file contains the MS2 spectra of all UCP1 cysteine, containing peptides identified in the dimedone-MS experiments in either their unmodified (NEM alkylated form) or dimedone alkylated form.

Excel files

  1. Supplementary Table 1 (148 KB)

    Iodo-TMT data file including summary of all identified proteins and peptides, those identified as substantially redox sensitive during thermogenesis, and pathway analysis.

Additional data